/
Case study
Streamlining the import of complex data sets
I was the lead designer on the Packs data import experience, working in a cross-functional group. I partnered with Product to shape the strategy, Customer Success, and Sales to figure out what needs to be built and set the proper success criteria, and conducted UX research to ensure a user-first experience. I also contributed to content guidelines, developed a roadmap with Product and Engineering, prototyped interactions, and designed components and the entire web UI. The project had its challenges, as we had to balance user experience, technical constraints, and limited resources.
Success metrics:
96%
Task Completion Rate
Reduced Time on Task
Complicated data import
Users utilize Packs analytical tools to assess risk and determine the appropriate amount of reinsurance. Packs allow them to gain rich insights, which ultimately leads to better pricing for their organization.
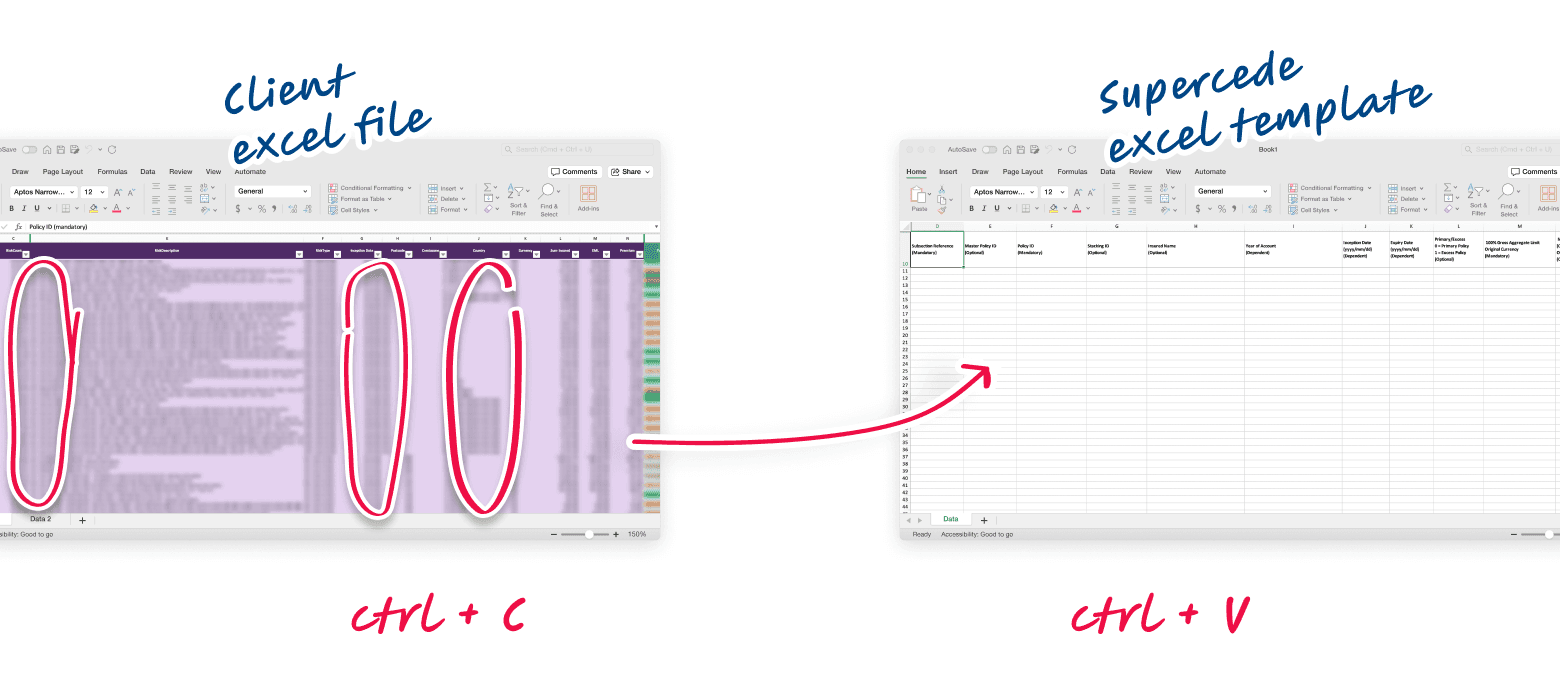
As an early-stage startup, to prove the concept and gain some traction, Supercede initially provided Excel templates to users, which they could fill out and upload to the system to transfer their data to the platform. This worked fine as a temporary solution but had some critical drawbacks:
Due to Excel limits, transferring large datasets from one file to another was complicated or impossible.
Users were forced to move data and do mapping manually each time.
Matching and mapping data fields between user files and templates became time-consuming due to inconsistent data schemes and metric names across different companies/regions.
Over time, the template structure changed causing conflicts when users attempted to upload data using outdated versions.
Clients still extensively utilized Excel, relying on Supercede only at the data analysis stage. The product wasn’t perceived as a self-sufficient solution but as one of the tools in a chain.
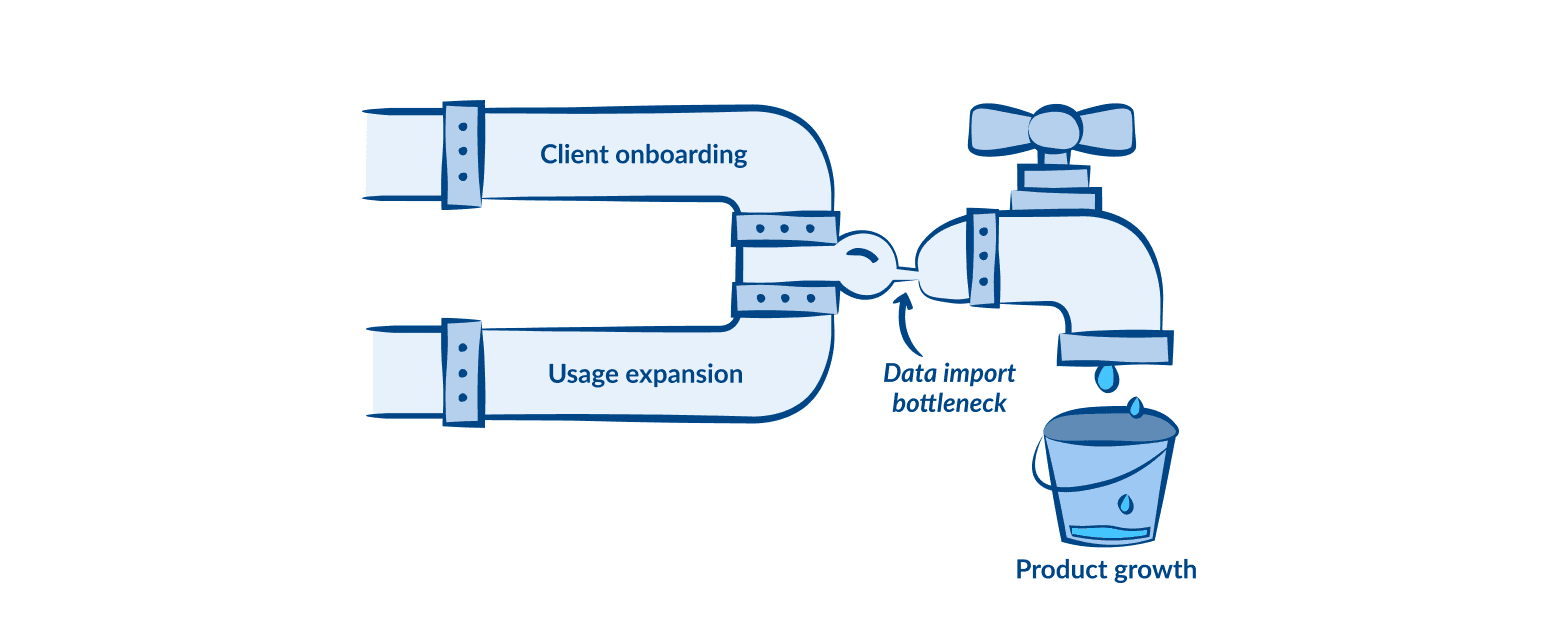
These issues increased the workload for customer support while intensifying customer dissatisfaction with the product and hindering clients' adoption and usage scalability of the Packs. To summarise:
Challenge
The project goal was to redesign the data import experience to better support our clients’ modern business needs, as determined by >95% process completion rates and a >40% reduction in time on task.
Supercede’s ambitions were to enhance data import capabilities, allow existing clients to escalate product usage, and give our sales department a strong selling point when demoing to the potential high-tier clients operating hundreds of data sets that can consist of millions of rows each.
Kickoff. Picking up the pieces
I had some educated guesses about improving the importing experience (or, better yet, what the users currently struggle with). However, it wasn’t enough to form hypotheses with which we’re ready to move on. I decided to go through the research phase to fill the gaps: conduct stakeholder and user interviews, usability testing, and competitor analysis.
Interviewing stakeholders from the Customer Success and Sales departments allowed me to learn more about existing and potential clients’ concerns and expectations regarding data import. It provided KPIs to measure success from a business perspective.
I discovered that many users still need help with data import even after extensive onboarding. Additionally, the system's struggle with handling large data sets and its overall inflexibility were major concerns for potential clients.
User interviews (mostly with cedents, as they are an essential user type primarily involved in the data analysis) helped me learn about existing users’ experiences and pain points. I also generated an unmoderated usability test to see how existing users were trying to map and import the data.
Competitor analysis helped me learn from existing indirect competitors and benchmark their initiatives to solve the issue. This allowed us to incorporate some existing patterns.
Uncovering needs
After synthesizing the data into actionable insights, the key discoveries were:
The data import process should be separate from uploading data files on the platform (upload now, initiate import when required).
Users need a way to import custom data files to omit opening Excel and so bumping into GUI data transfer limits.
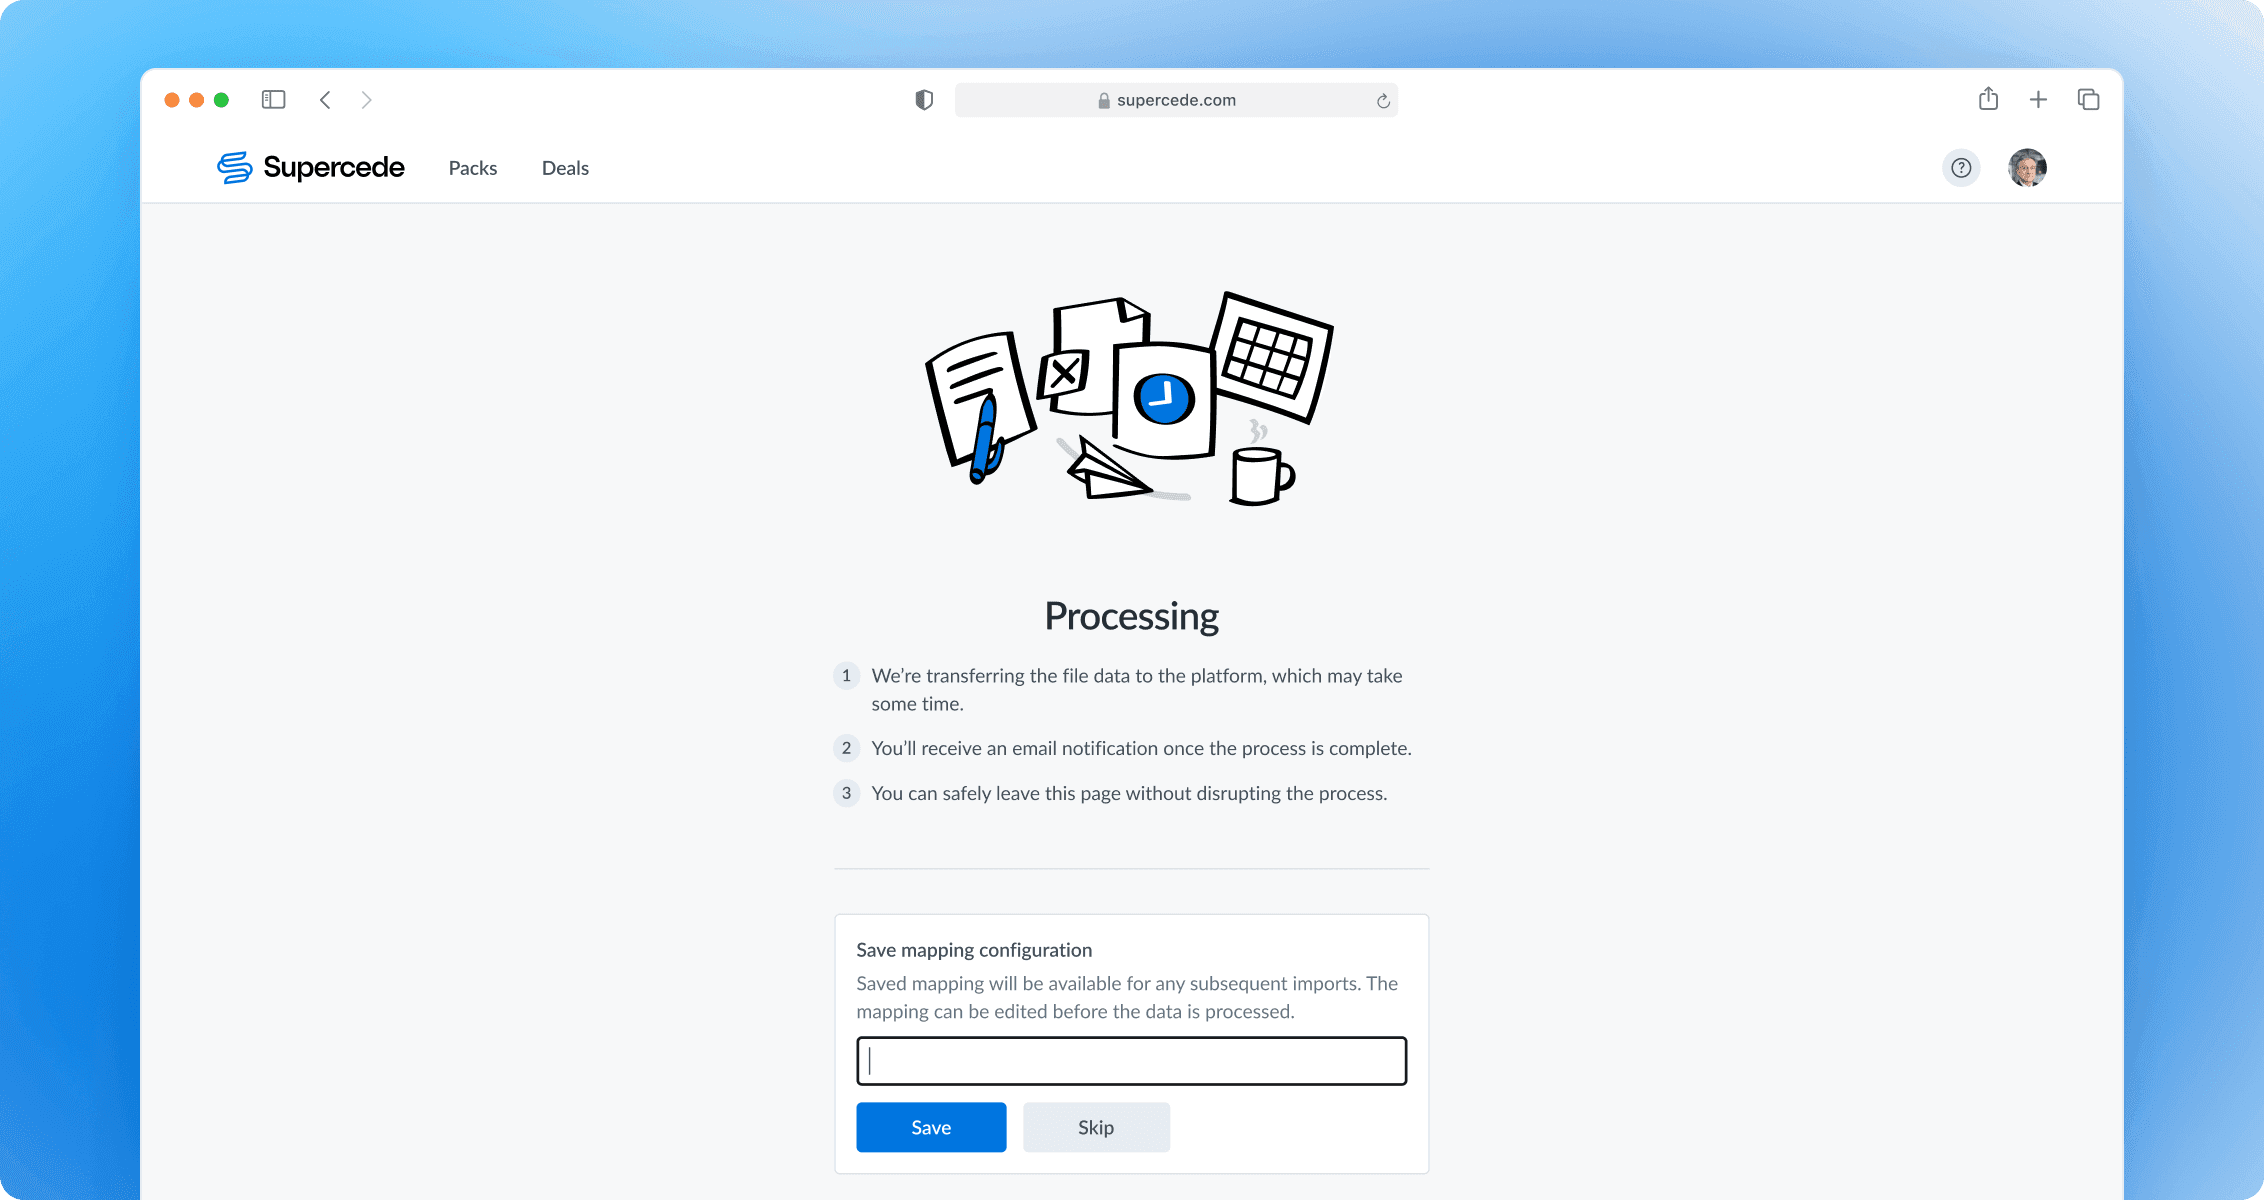
Users require a mechanism to save data mapping as config to make it available for subsequent imports.
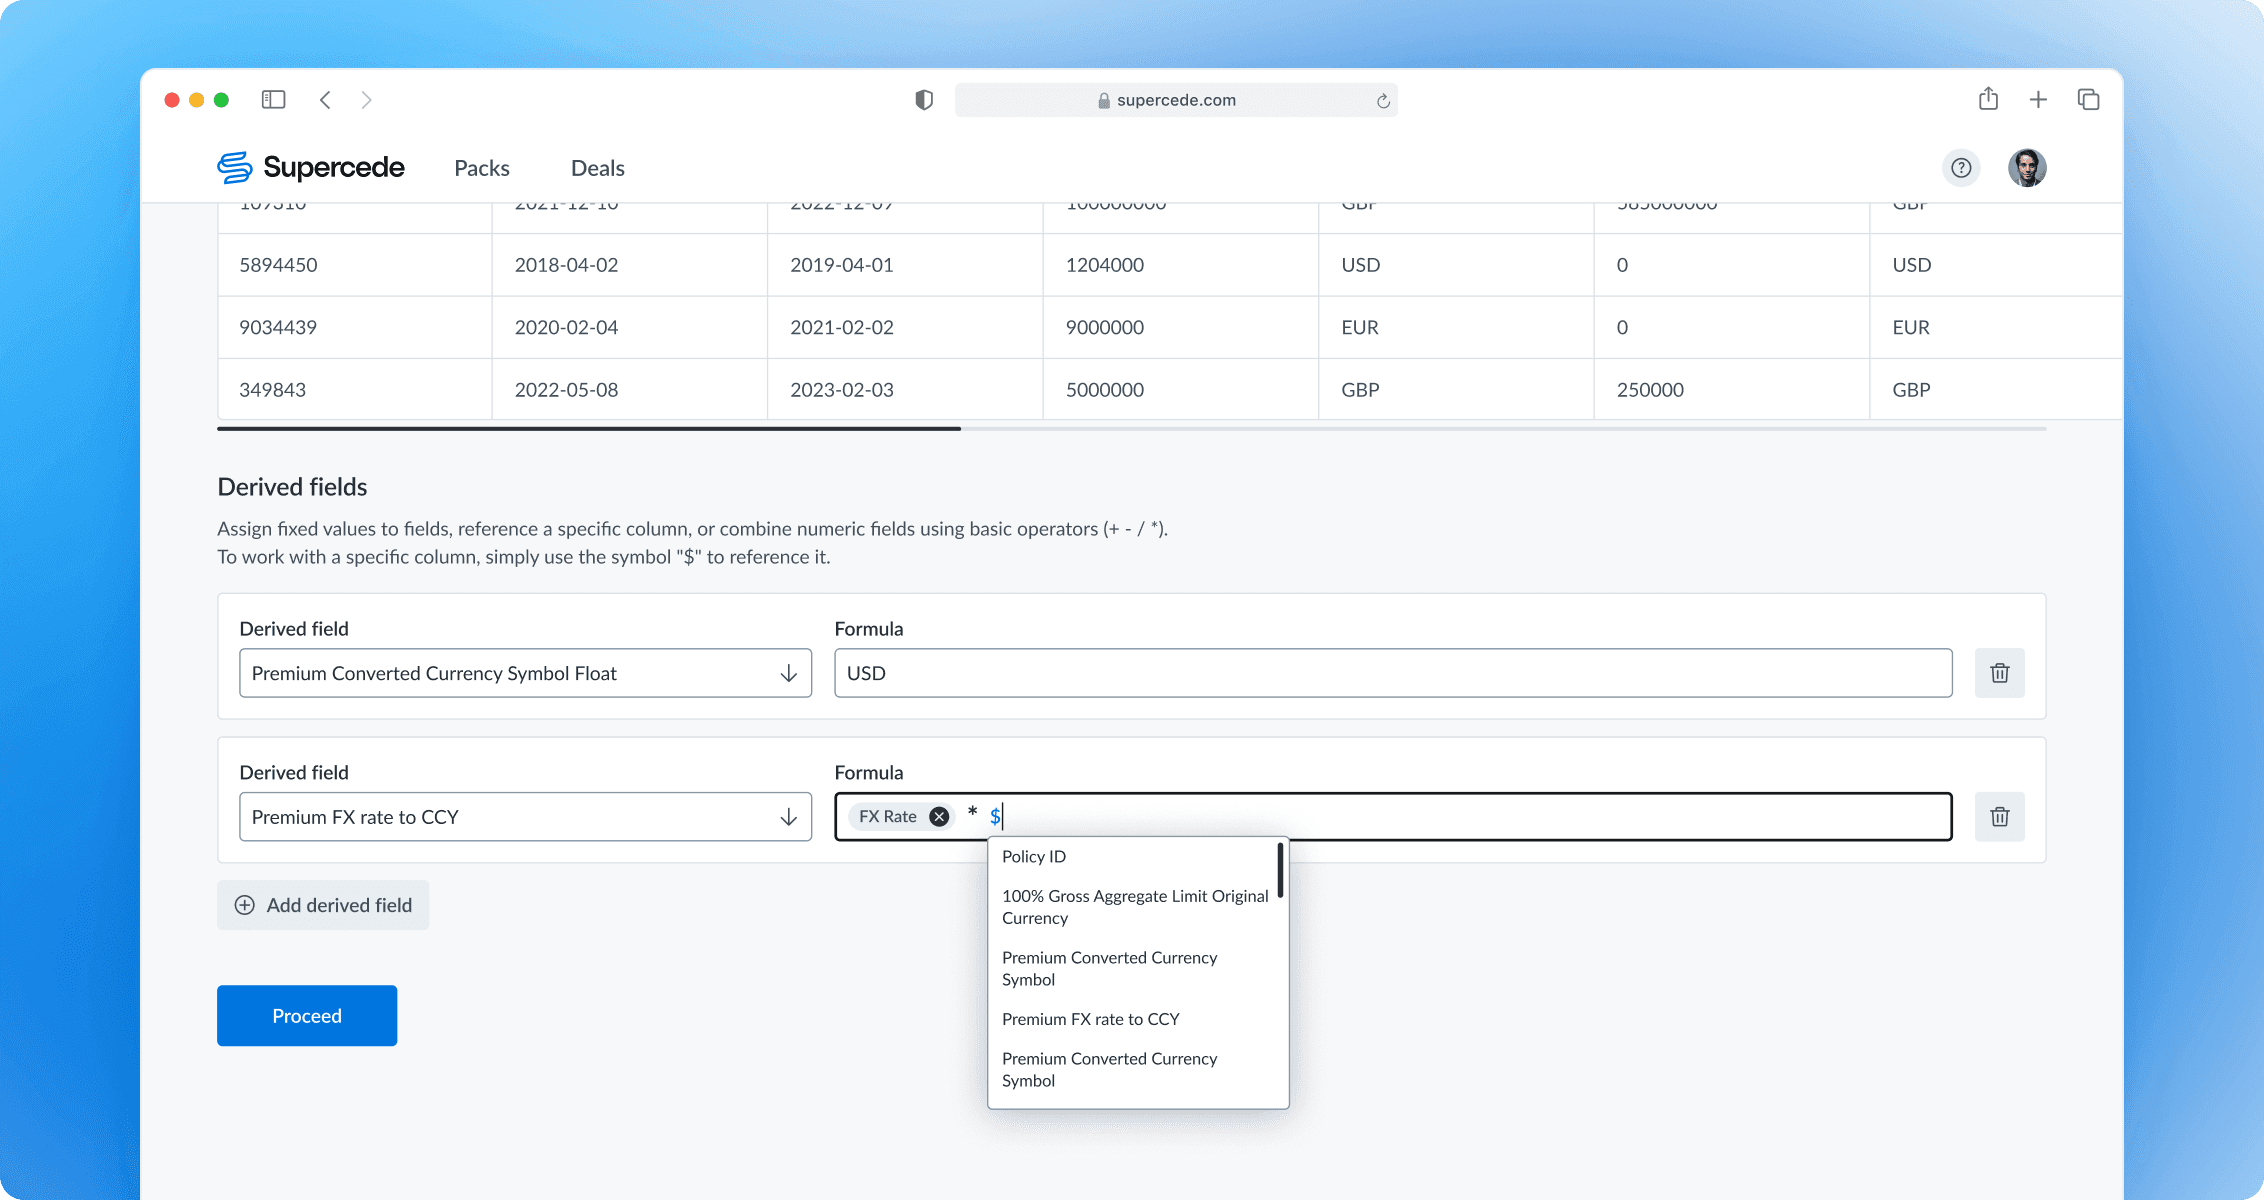
Users should have the ability to derive fields using simple formulas or fixed values.
Additionally, some clients are willing to import data using API (as I wasn't involved in the API project, it won't be covered in this case study).
Behavioral metrics & KPIs
From the user perspective, we wanted to measure success by tracking the Task Completion Rate, Time on Task, Error Rate, and the number of requests to customer support. While working on the project, we identified two additional metrics to track: the number of packs created per client with the updated experience and the ratio of template to non-template imports.
From a business perspective, we wanted to ensure we could track Customer Satisfaction and Effort Scores.
Possible solutions
We thought about three ways to tackle the issue:
Develop an Excel plugin for data import. The idea seems convenient, as users are familiar with the tool. However, it would deepen our reliance on Excel, making Packs less self-sufficient. Also, it wouldn't fully address the limitations of GUI-based data transfer.
Look into existing data import SaaS. We trialed such products, but none met our technical requirements. We also aimed to control the product's development independently without being restricted by a third-party product roadmap. Additionally, there were some pricing concerns.
Create a custom data import solution. Even though it might take more time and resources, we decided to go for it because it could support product growth in the long run.
After choosing a custom importing experience, we moved from planning what to build to figuring out how to build it.
Data validation & cleansing — complicated and time-consuming
During the alignment session, we identified the riskiest assumption: we might struggle to deliver failure-proof data validation and cleansing in a reasonable time, which is crucial for the entire idea. To tackle this, the Engineering team conducted a series of tests using real data sets to prove overall implementation and explore possible edge cases. They're able to confirm that implementation is possible with allocated resources.
Scoping work. Experience-based roadmap
In discussions, we recognized that delivering the entire experience might not be feasible. We decided to break the scope into smaller, more discrete experiences that are still complete tasks. While we understand that users need all the features to fully benefit from the new importing experience, we aimed to demonstrate to clients that the product is progressing.
First Iteration: Users can upload custom data files and map fields on the platform.
Second Iteration: Users can save mappings as presets and apply them to files with the same structure.
Third Iteration: Users can calculate data using formula operations and map these data to the fields.
As-is and To-be user flows
To align with stakeholders and some of the clients, I outlined the existing importing experience and the new flow with the addition of on-platform data mapping.
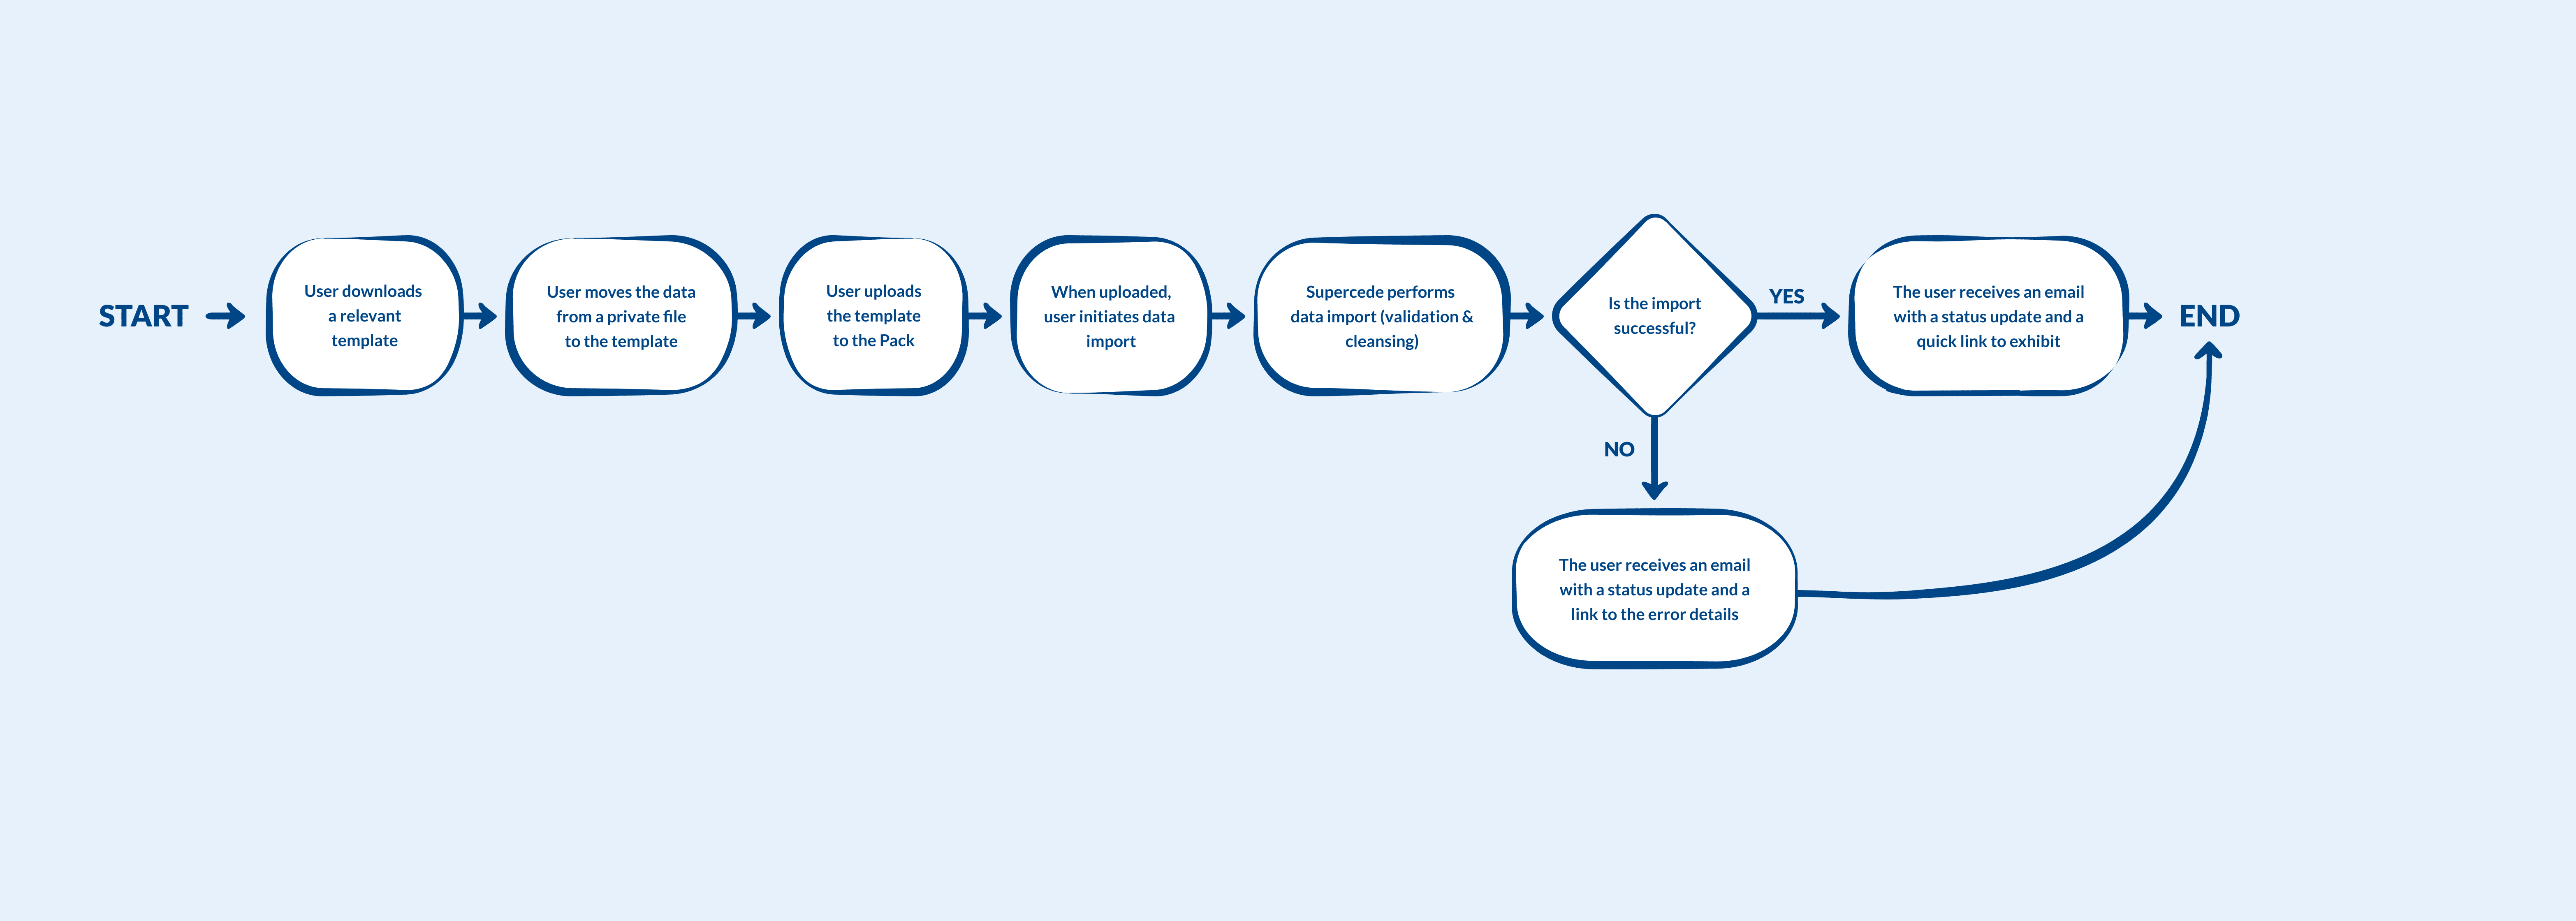
As-is

To-be
Wireframing (data import interactions)
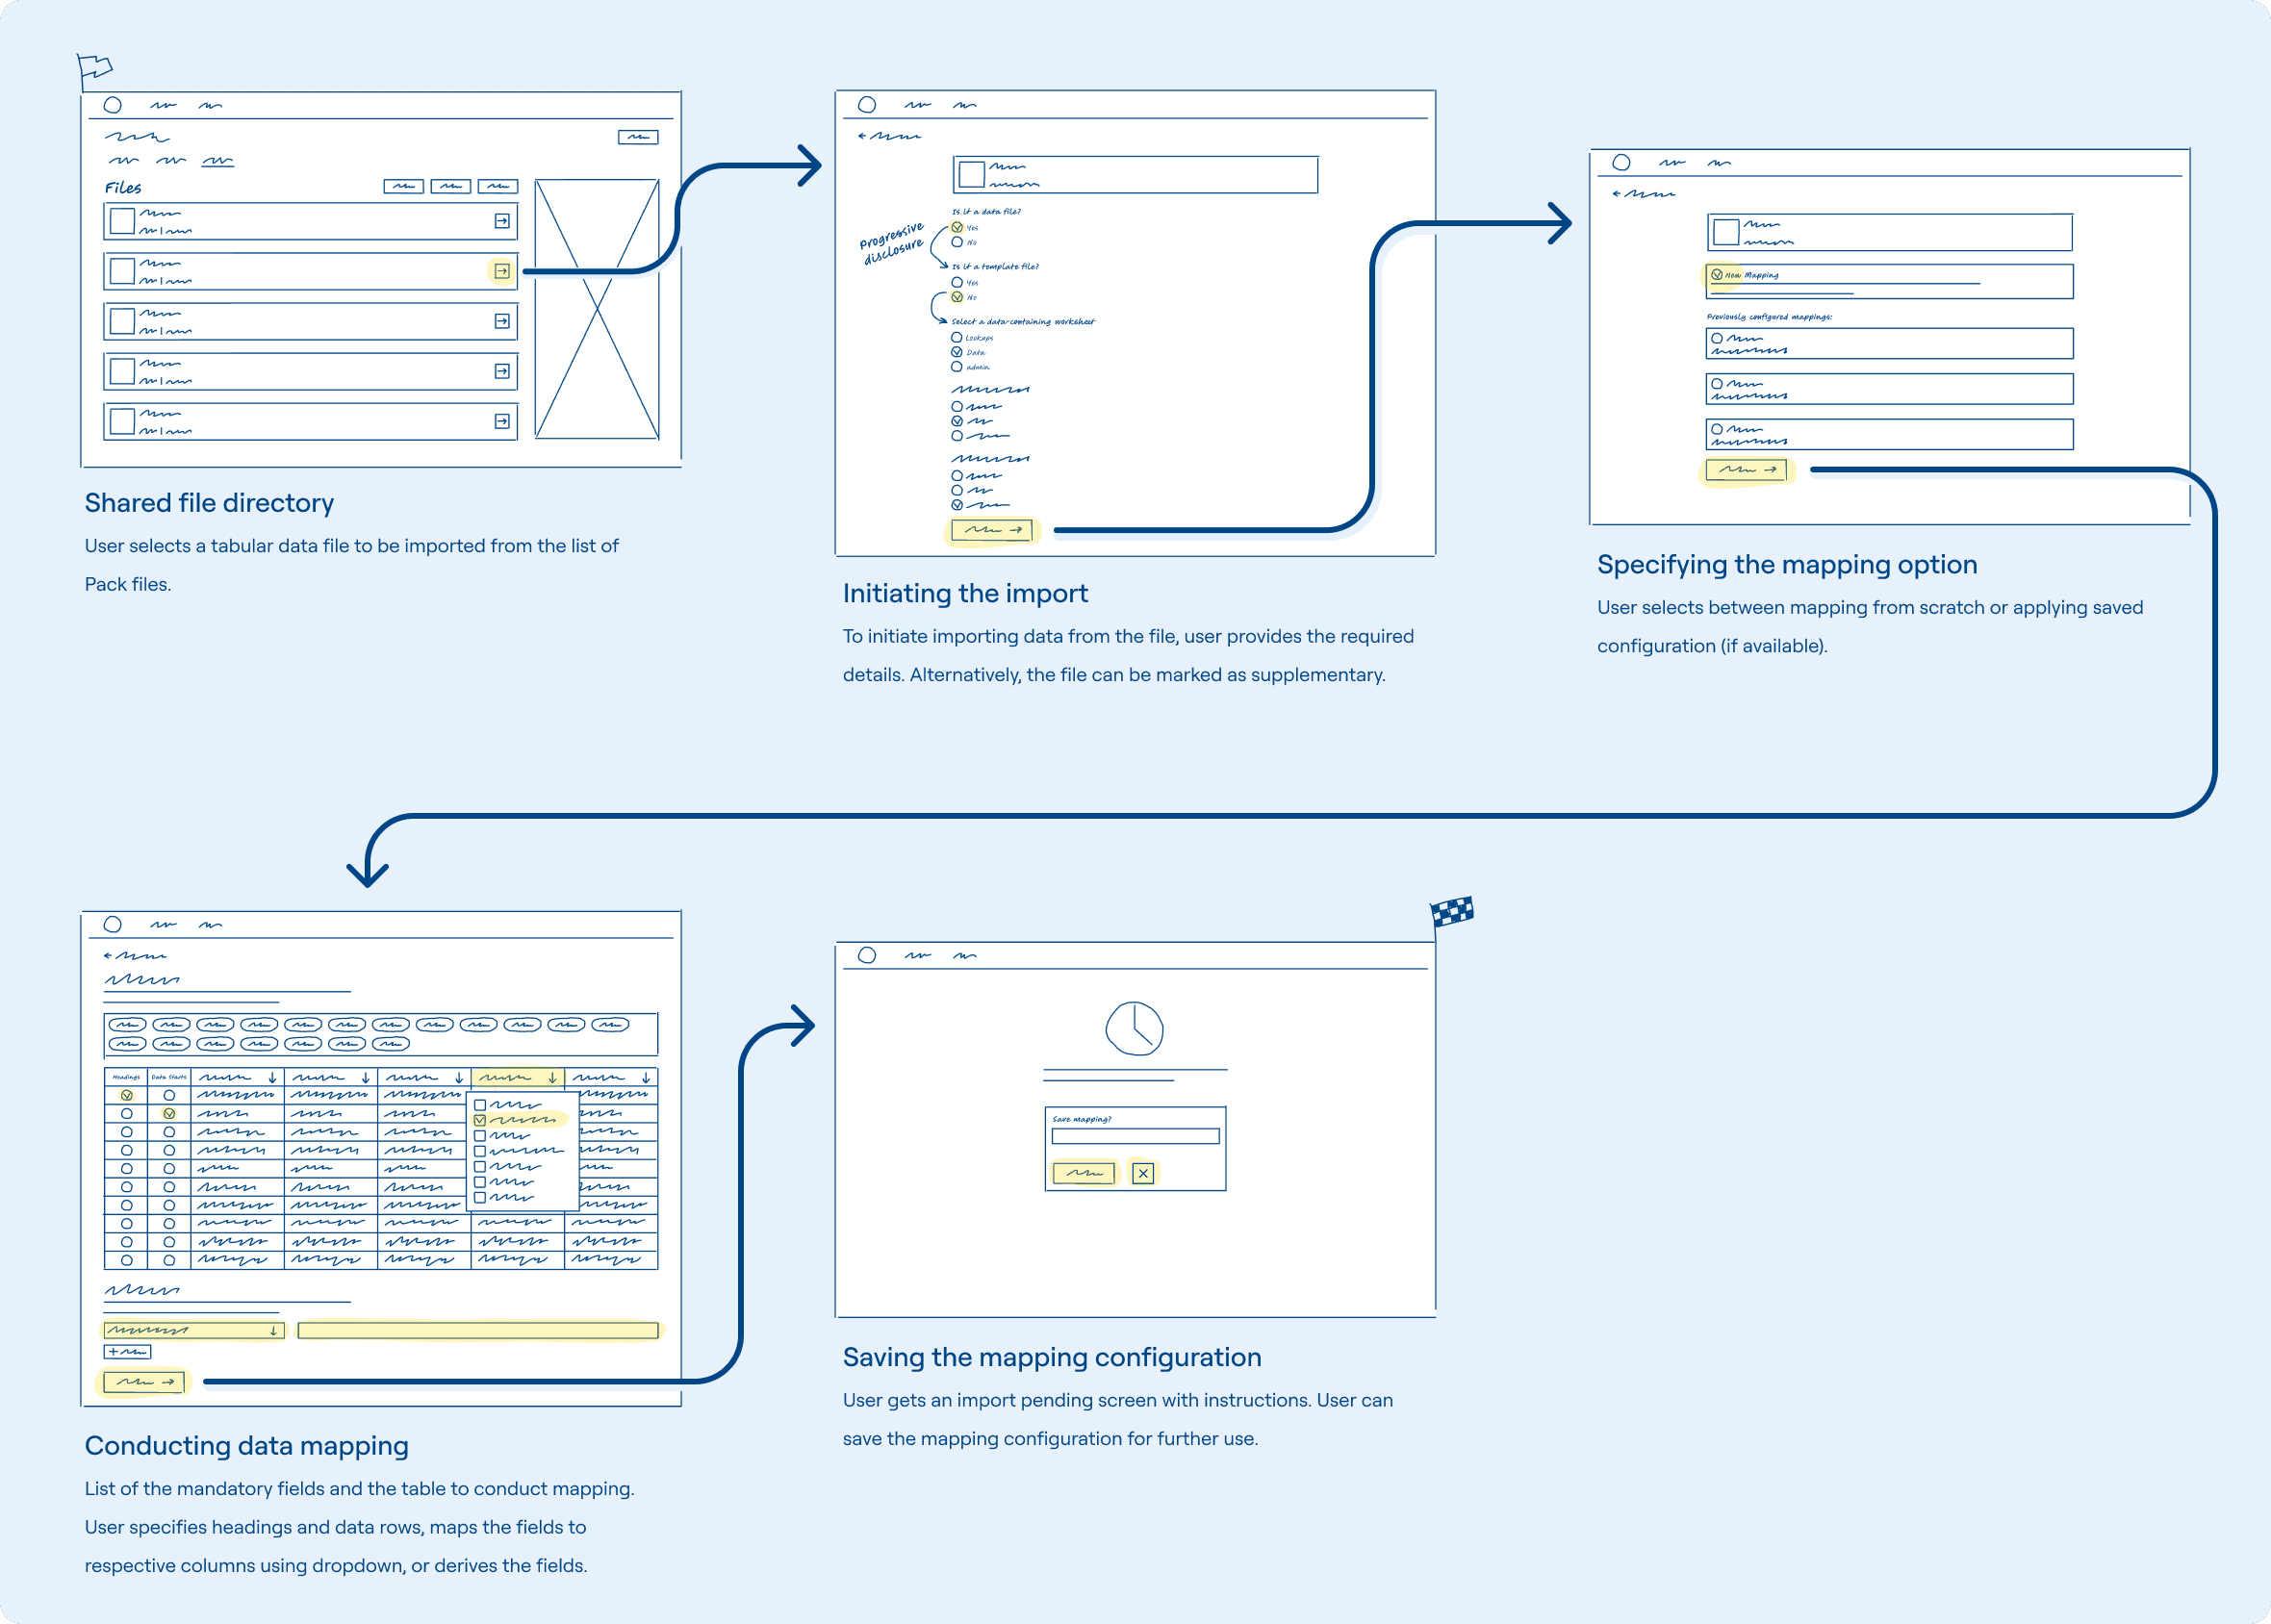
Sketching out a rapid solution helped me explore different alternatives and gather feedback from the stakeholders and users. It also demonstrated what interface elements would exist on key pages and helped map the interactions.
High-fidelity designs (UI)
I developed an interactive prototype for the data-sharing flow using existing components and Figma’s prototyping capabilities for early-stage usability testing. Later on, we built a coded prototype for more detailed testing.
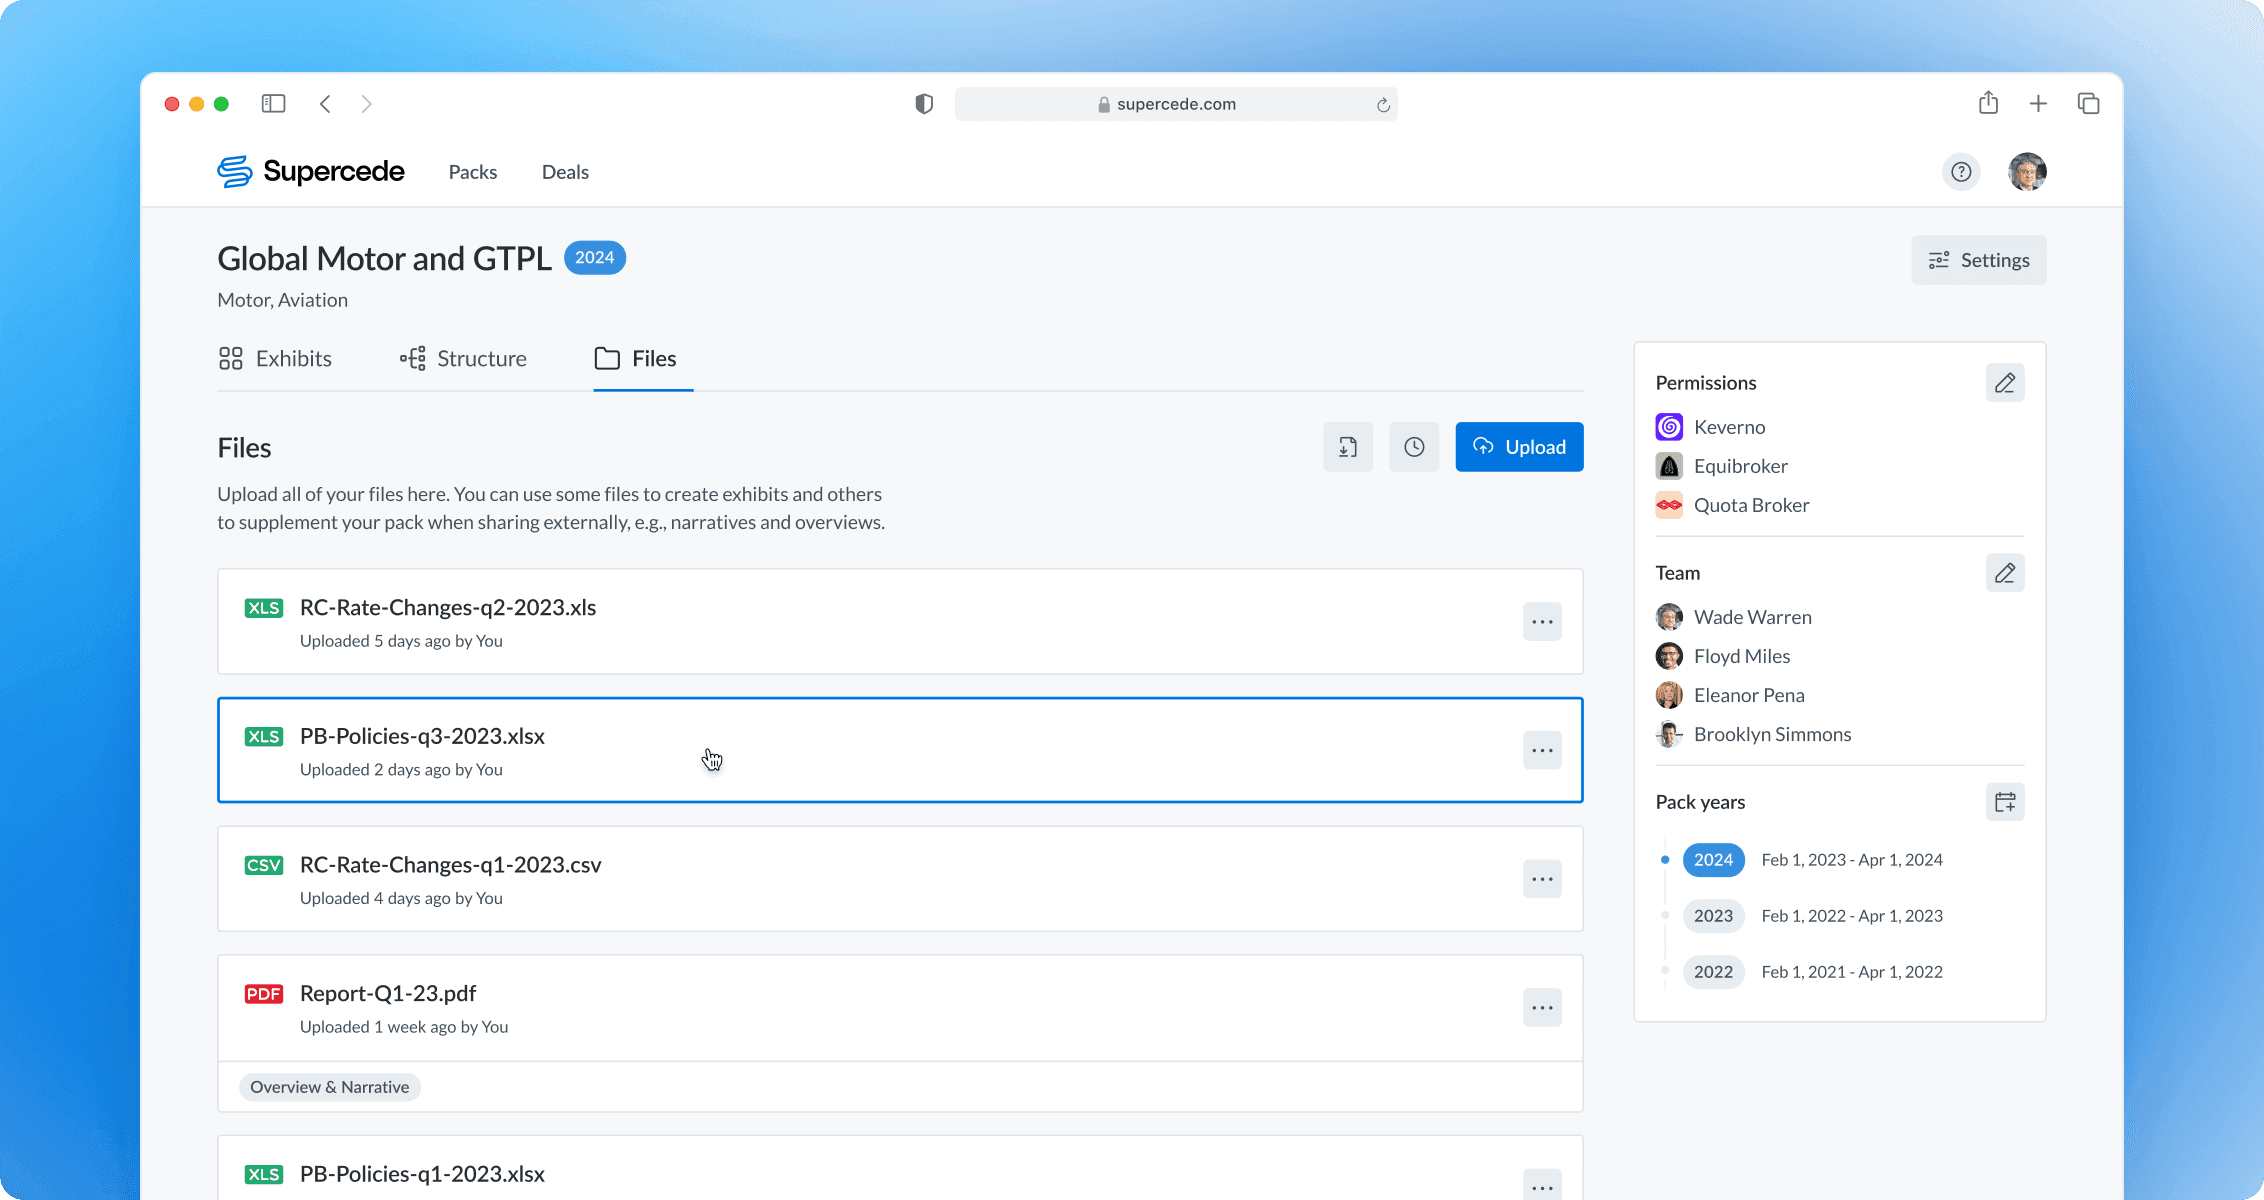
Shared file directory
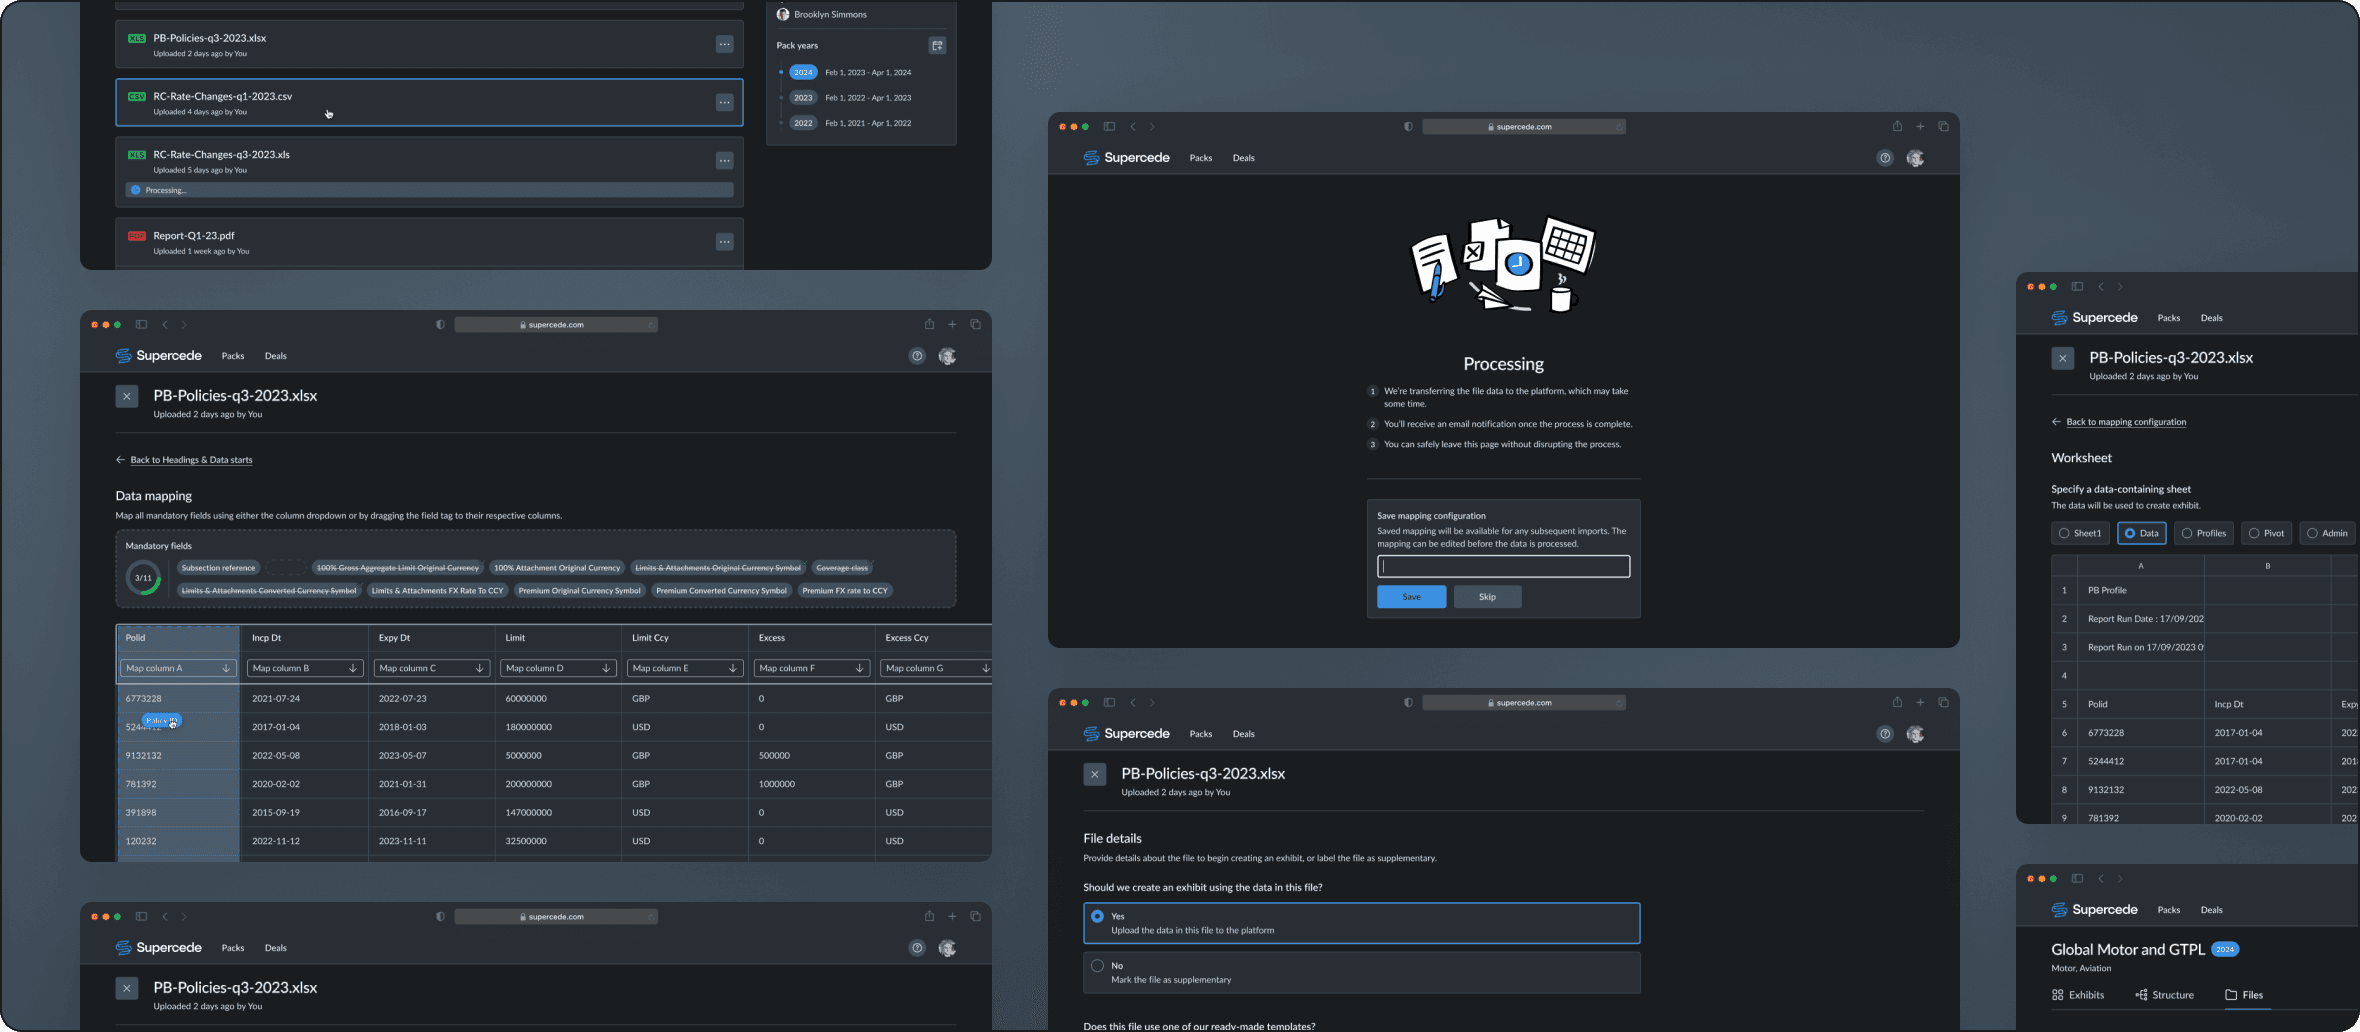
Previously, uploading and importing data files were combined into a single step, which was problematic for users who needed to upload multiple files but import them later. The new process separates these tasks, allowing users to upload files and import them independently. This change lets different team members handle each task separately, improving flexibility and efficiency.
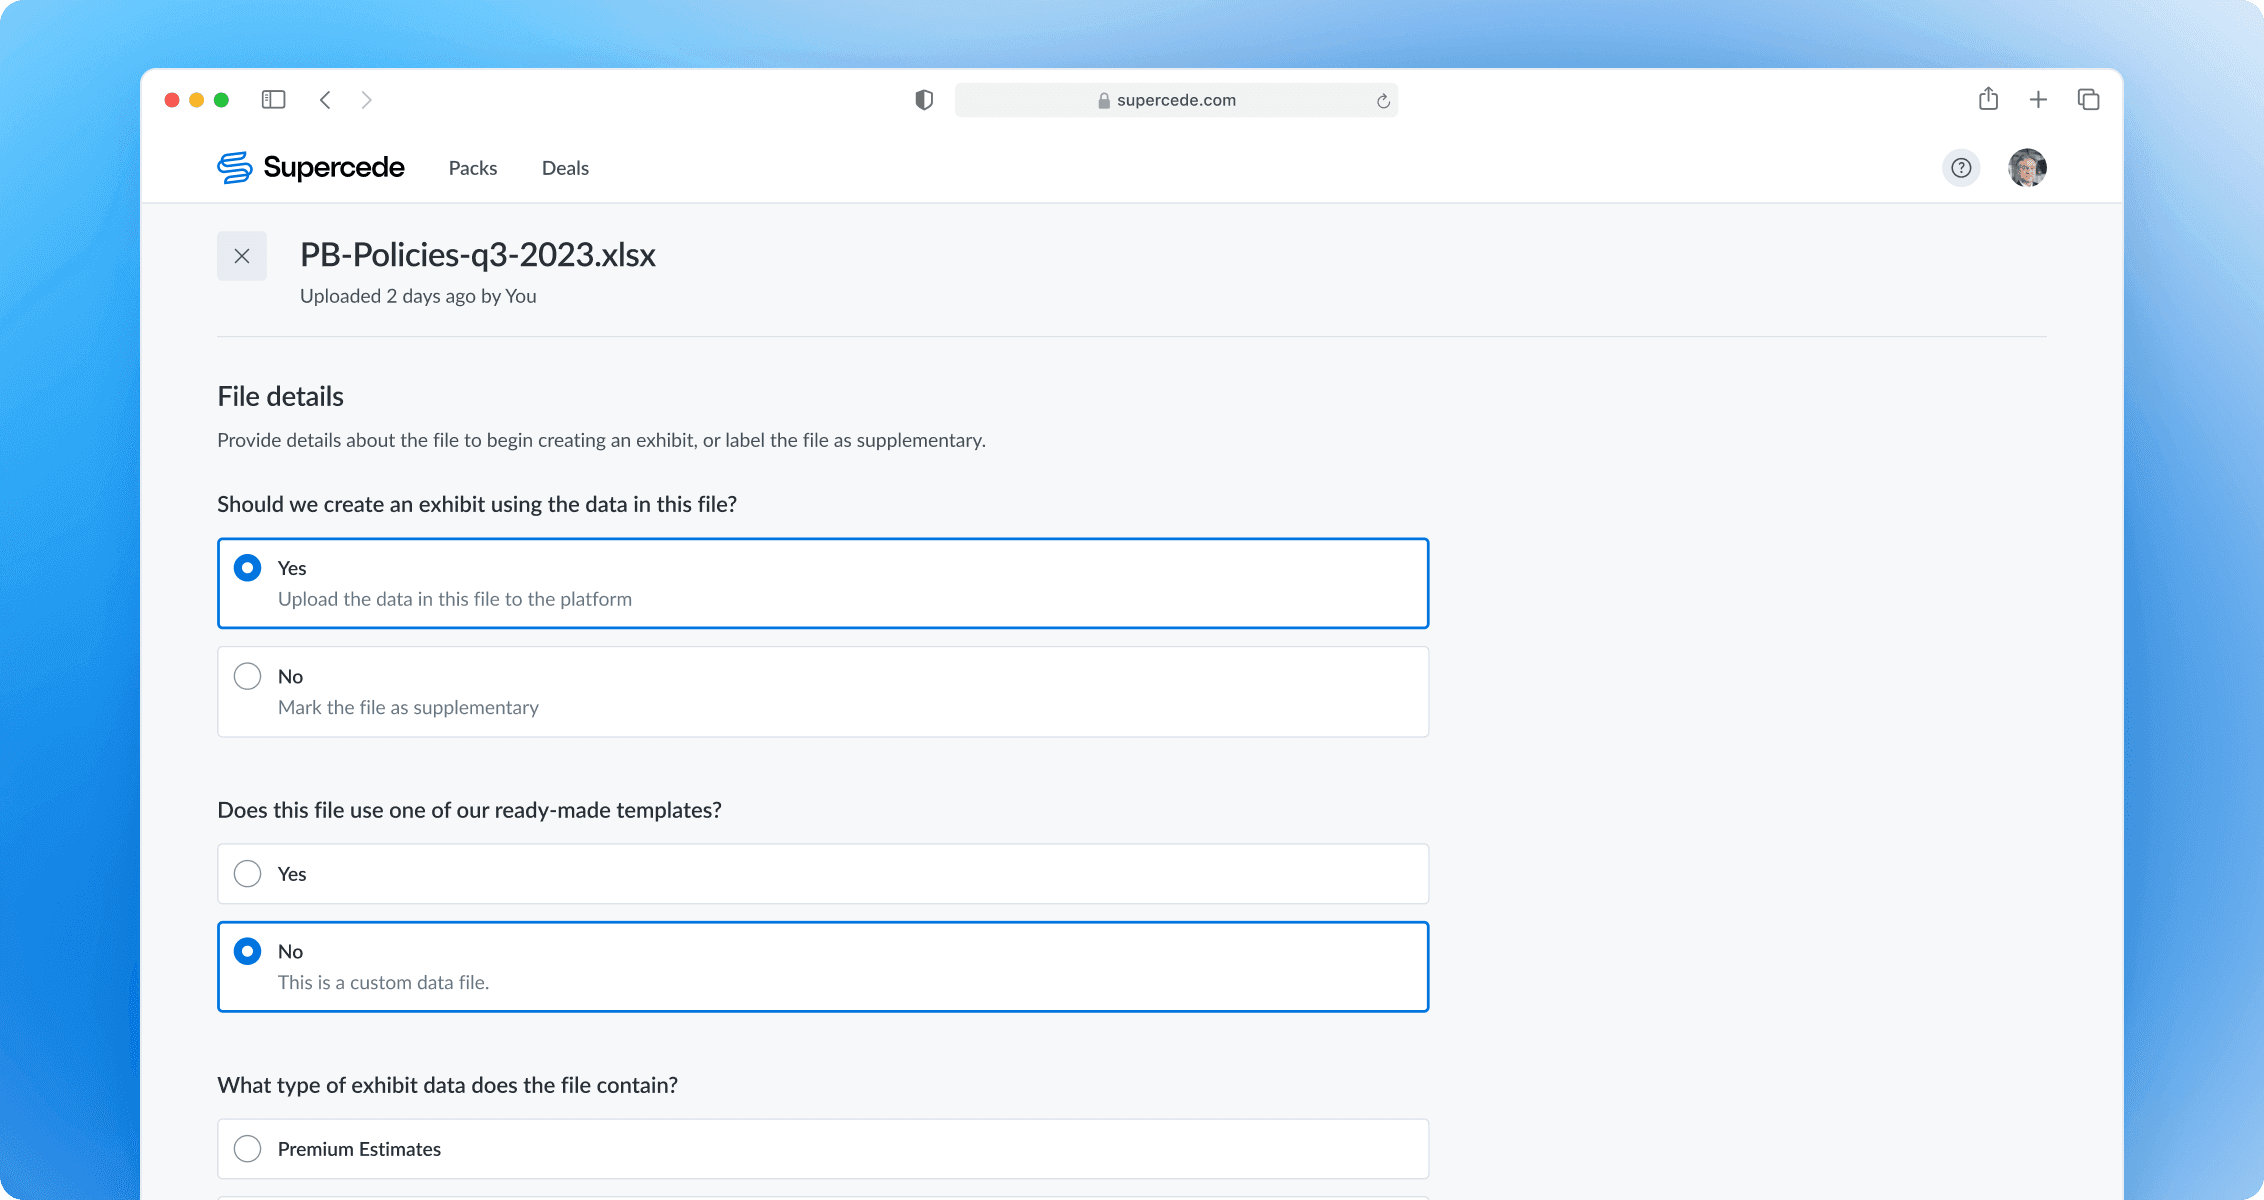
Initiating the import
Users provide file details to initiate data import. Progressive disclosure and hints guide them toward correct choices. Alternatively, they can mark the file as supplementary.
Specifying the mapping option
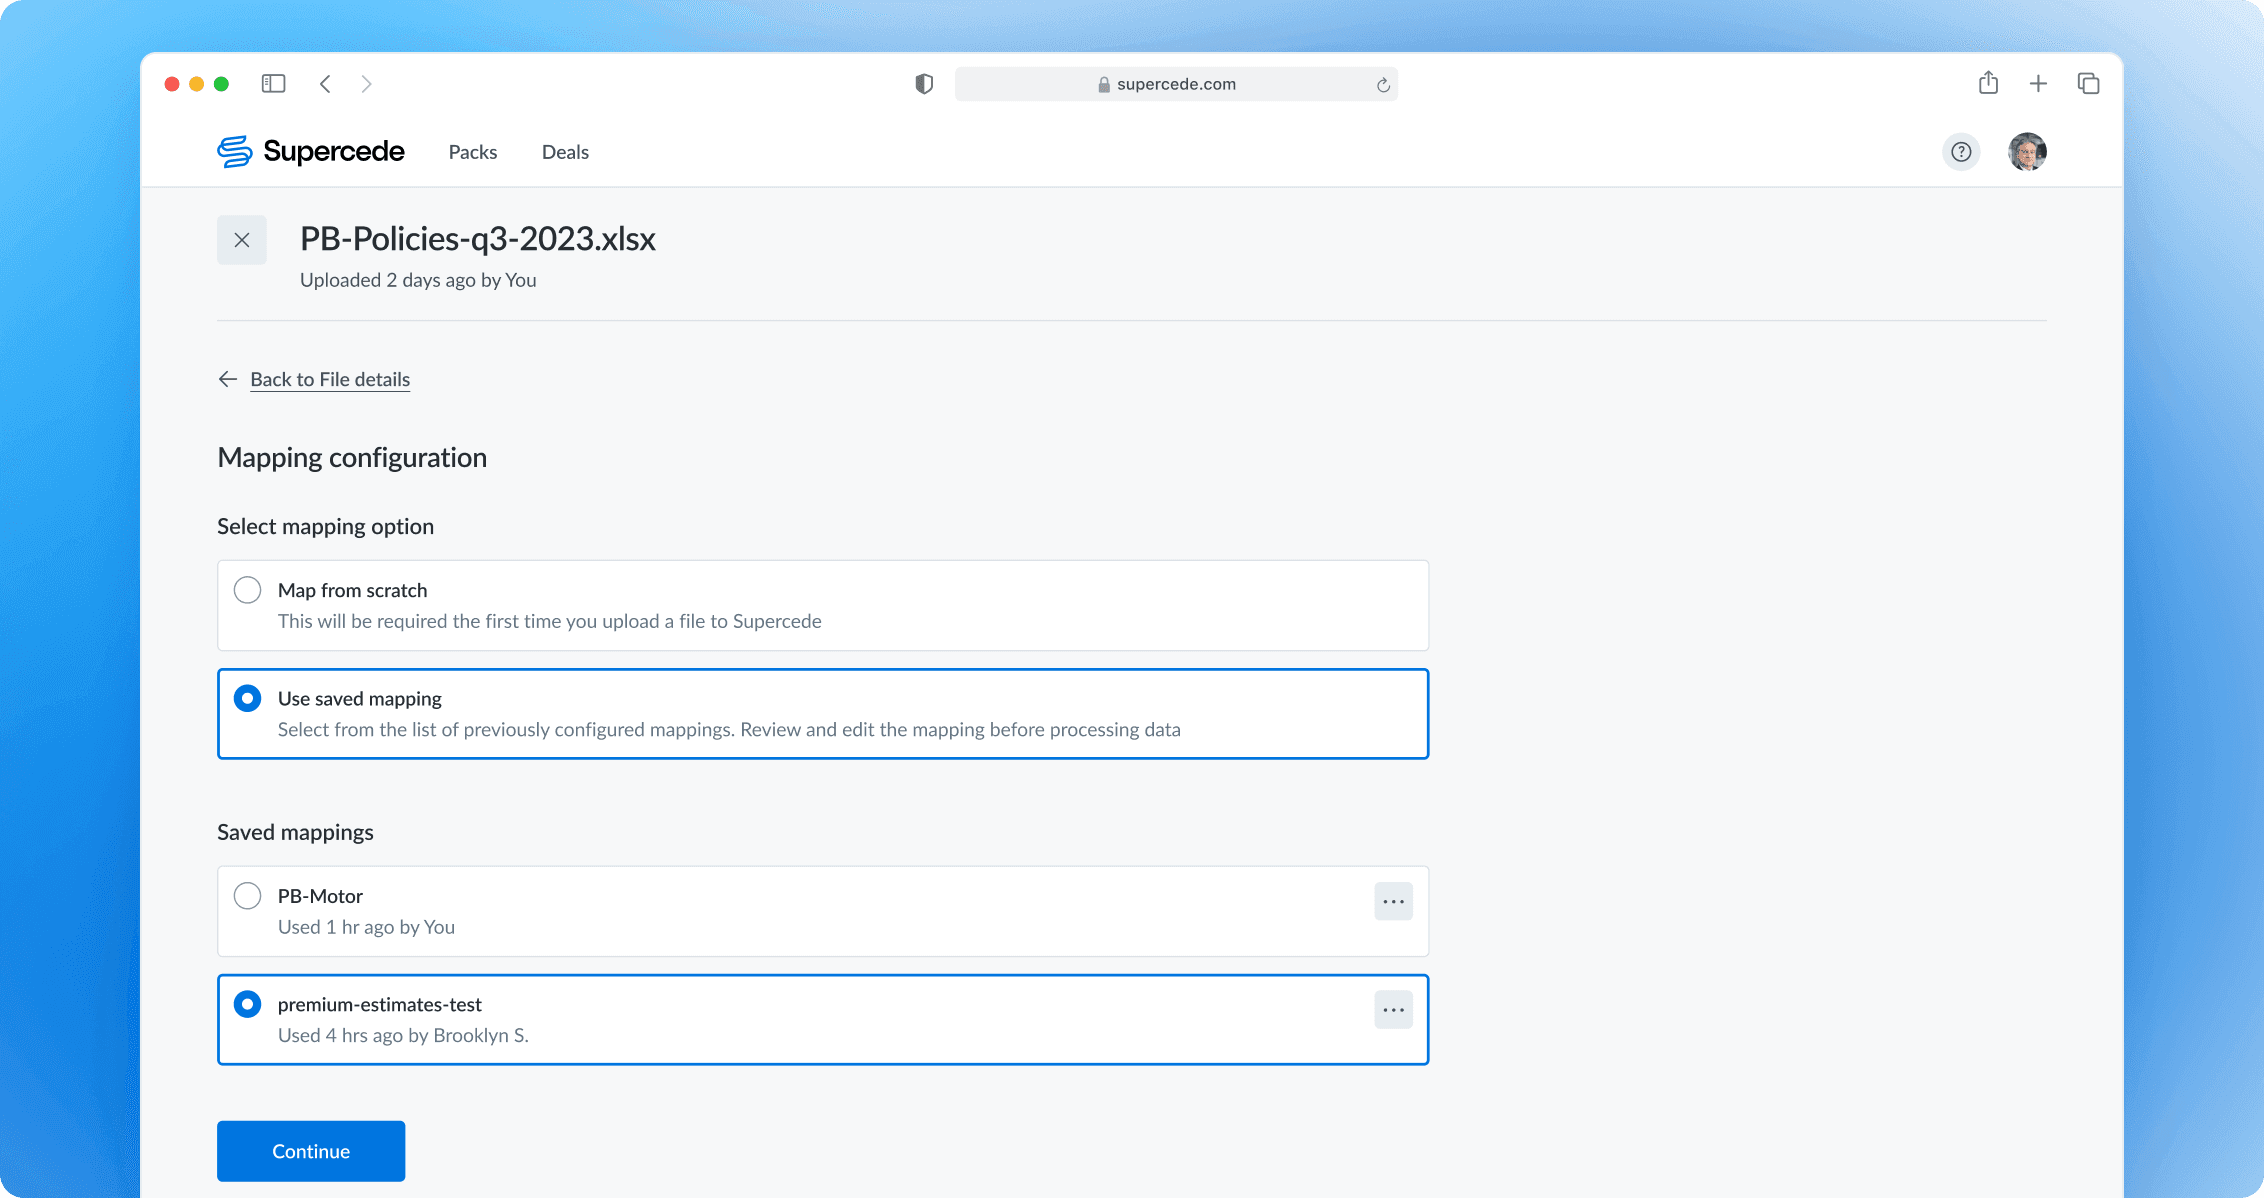
Users can choose between starting mapping from scratch or applying a previously configured mapping. If they select a saved configuration, they can still review and adjust it in the next step to fix any possible issues.
Selecting the worksheet
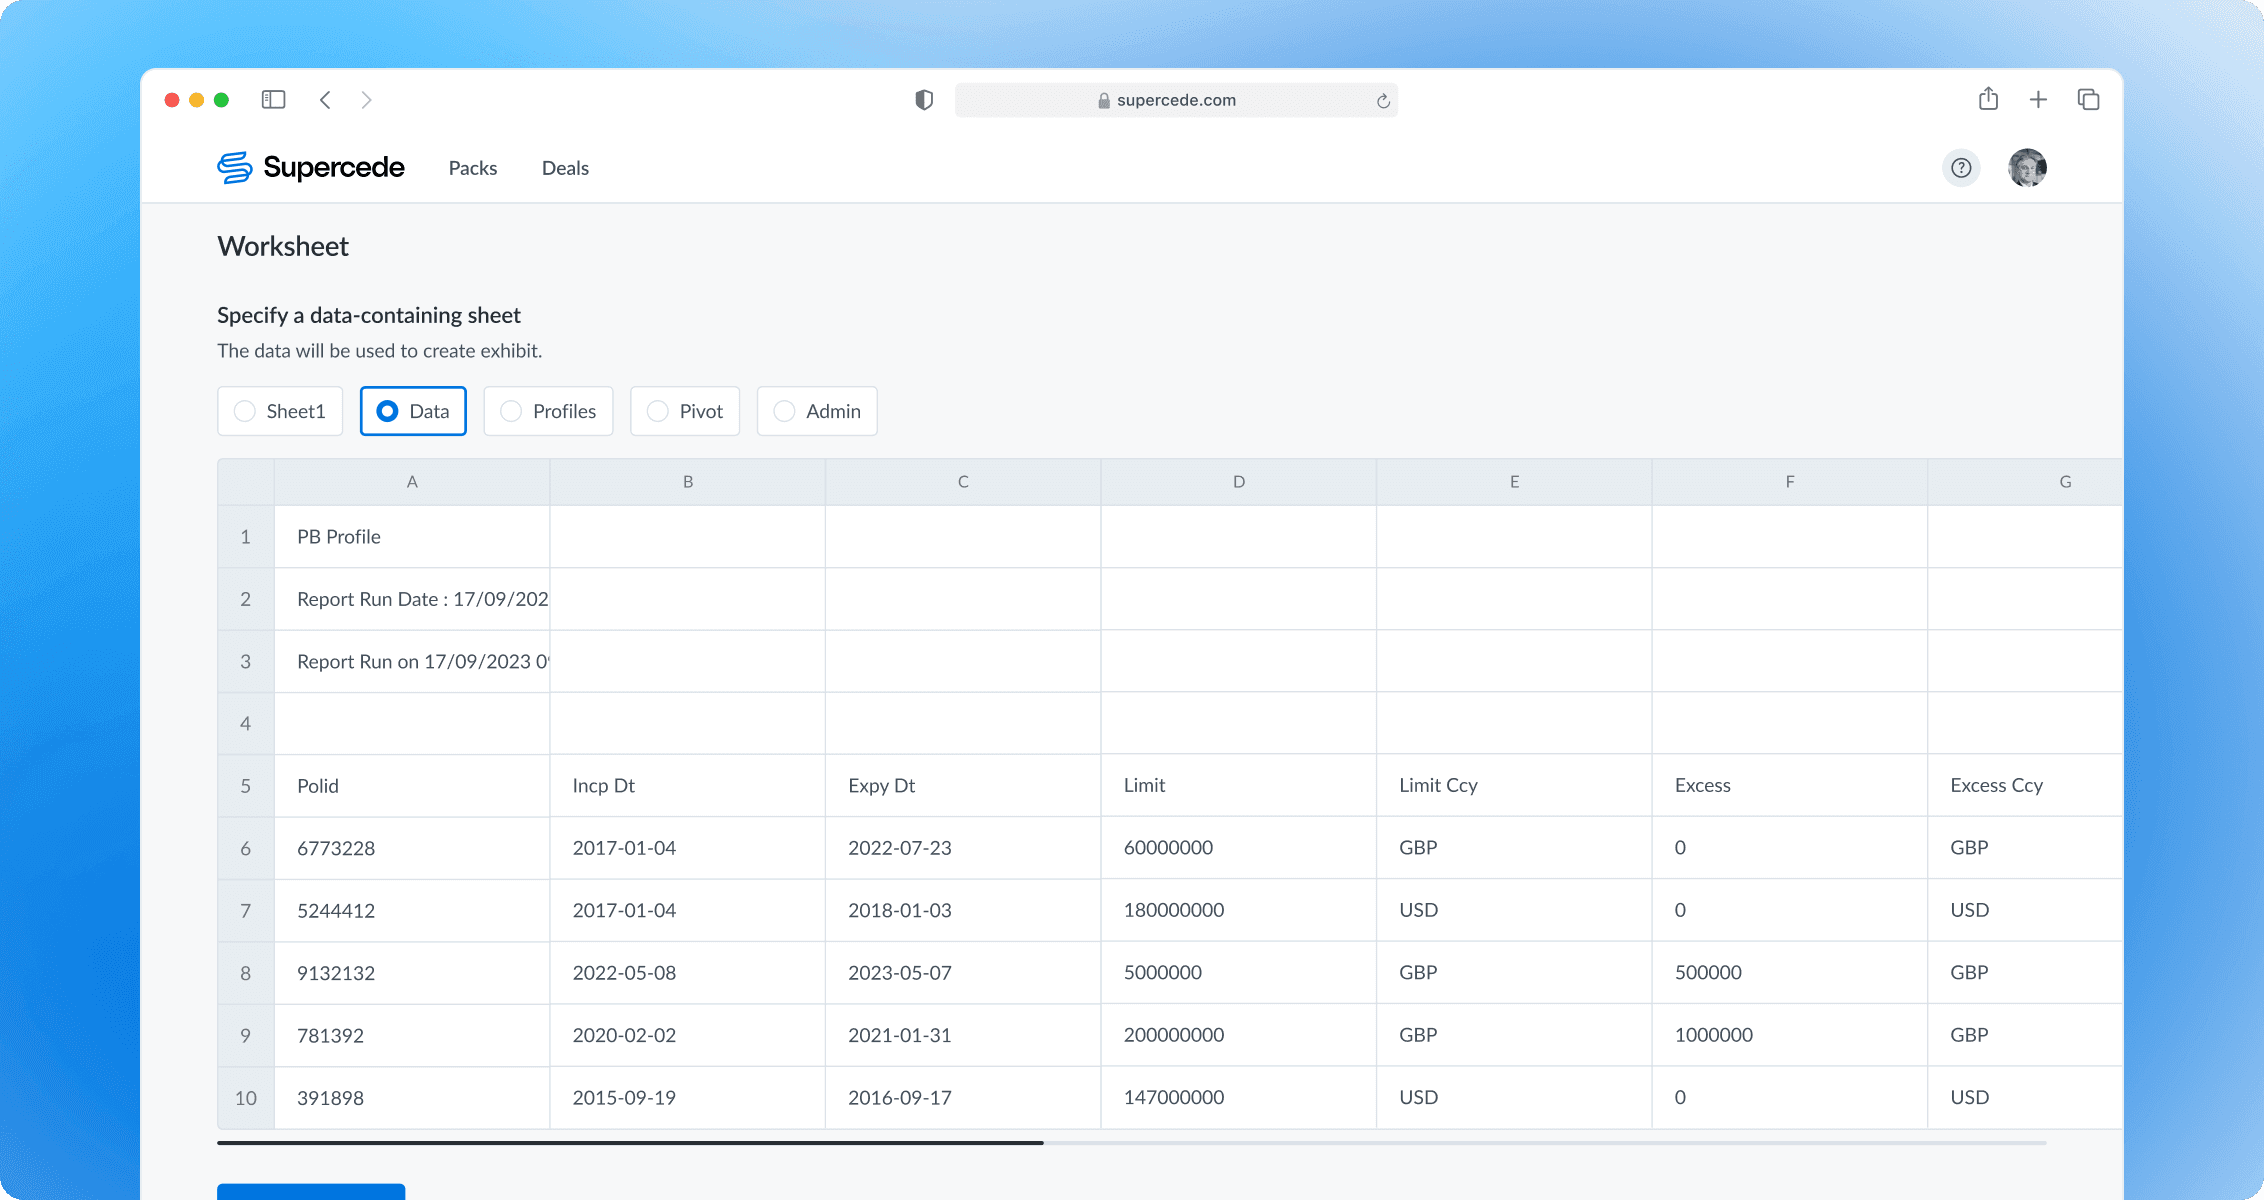
If the file has multiple sheets, users are required to select the one with the data for the exhibit. A preview helps ensure the correct sheet is chosen.
Choosing header and first data rows
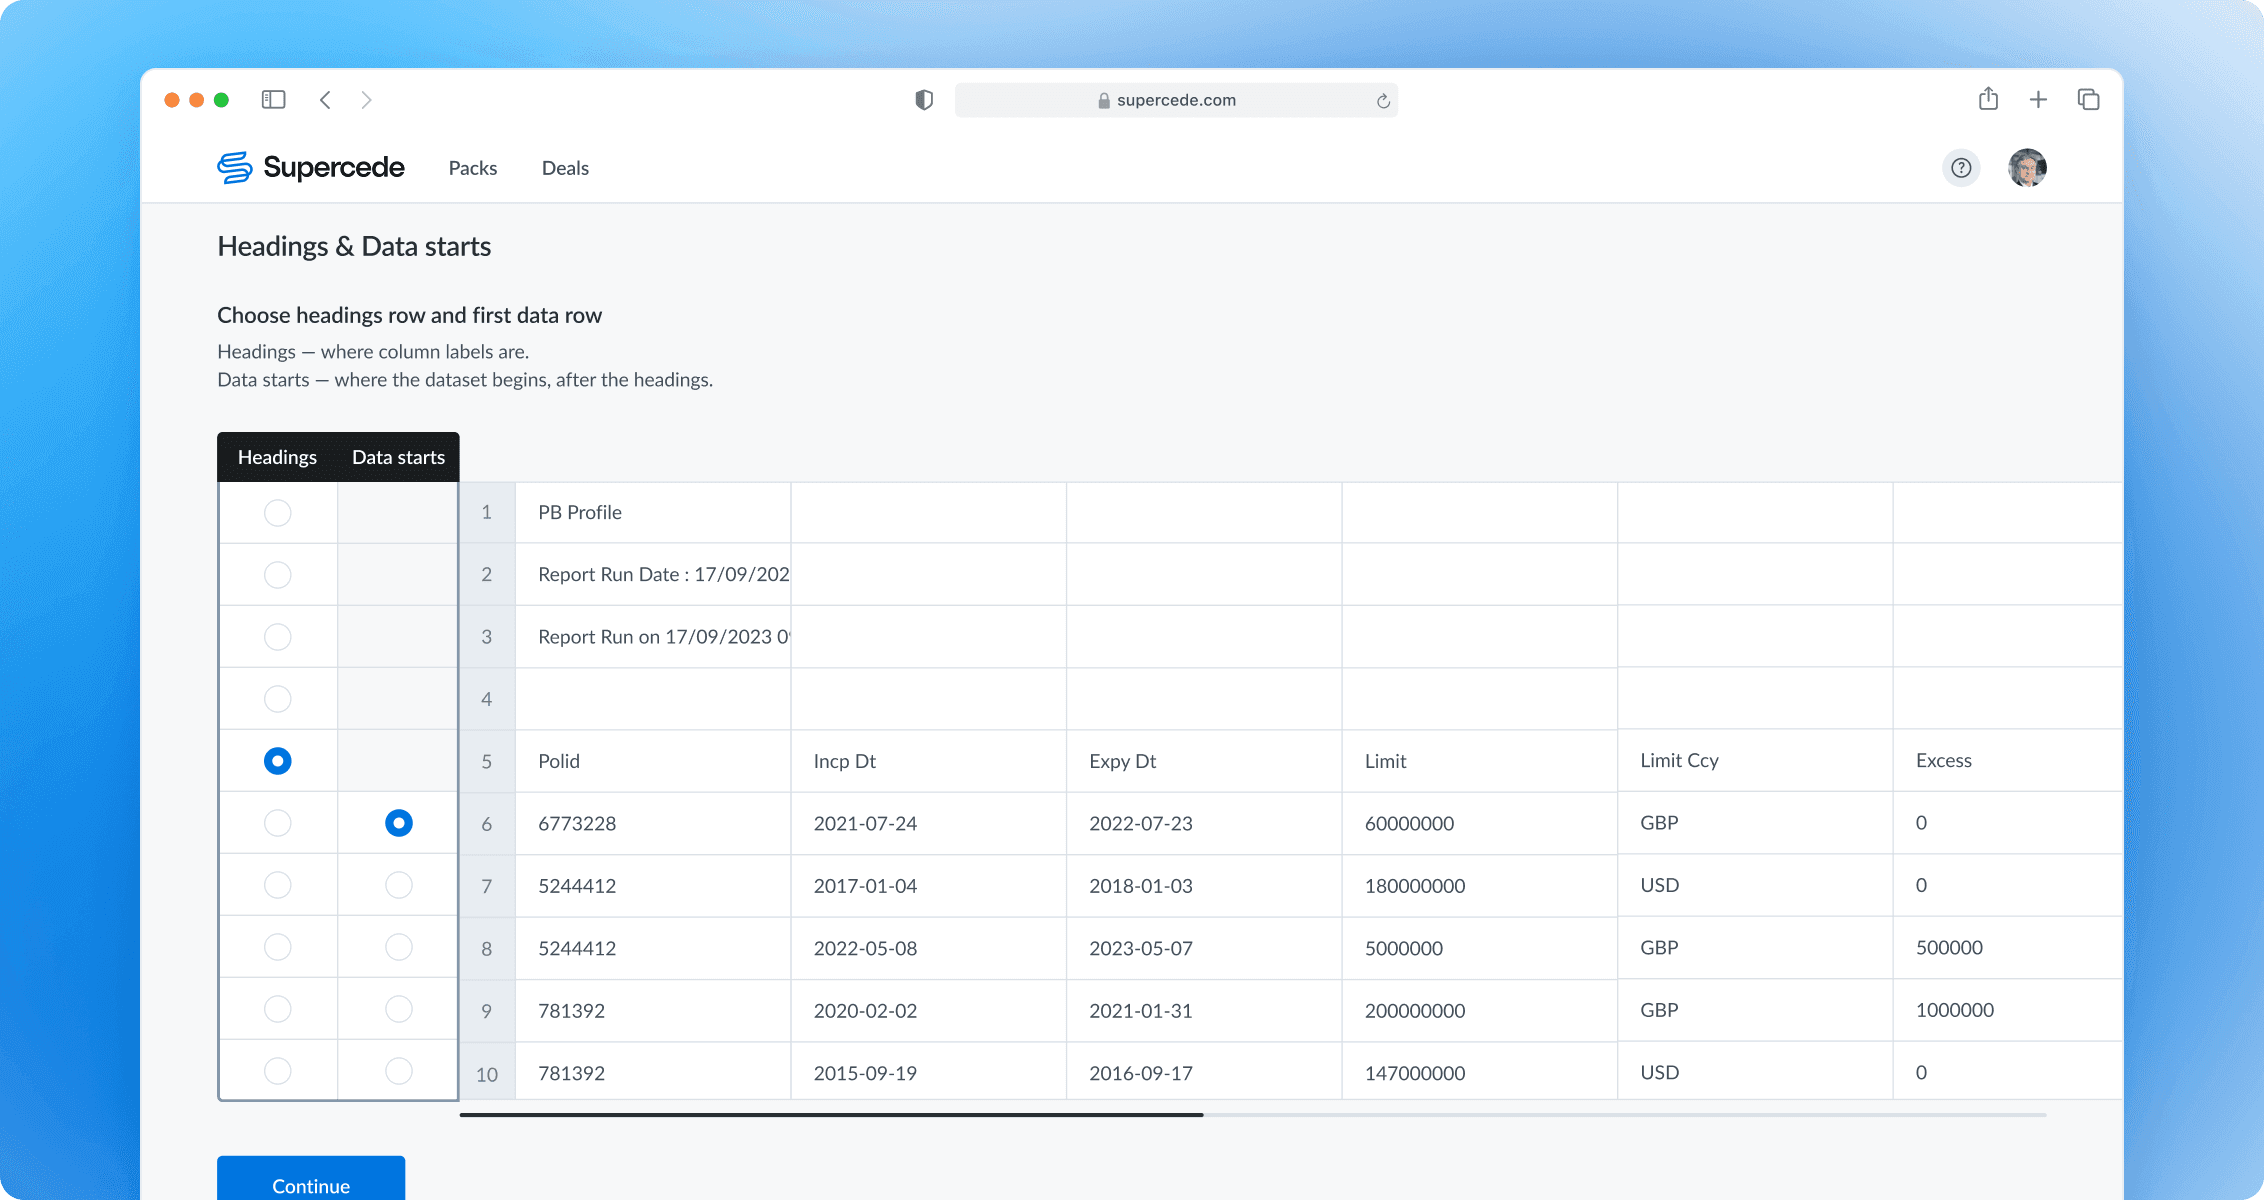
Since custom data files have different structures, users specify the header and starting data rows. This step ensures a consistent mapping experience, allows adapting the UI for the next step, and helps gradually scale the keyword base to improve the field suggestion mechanism.
Conducting data mapping
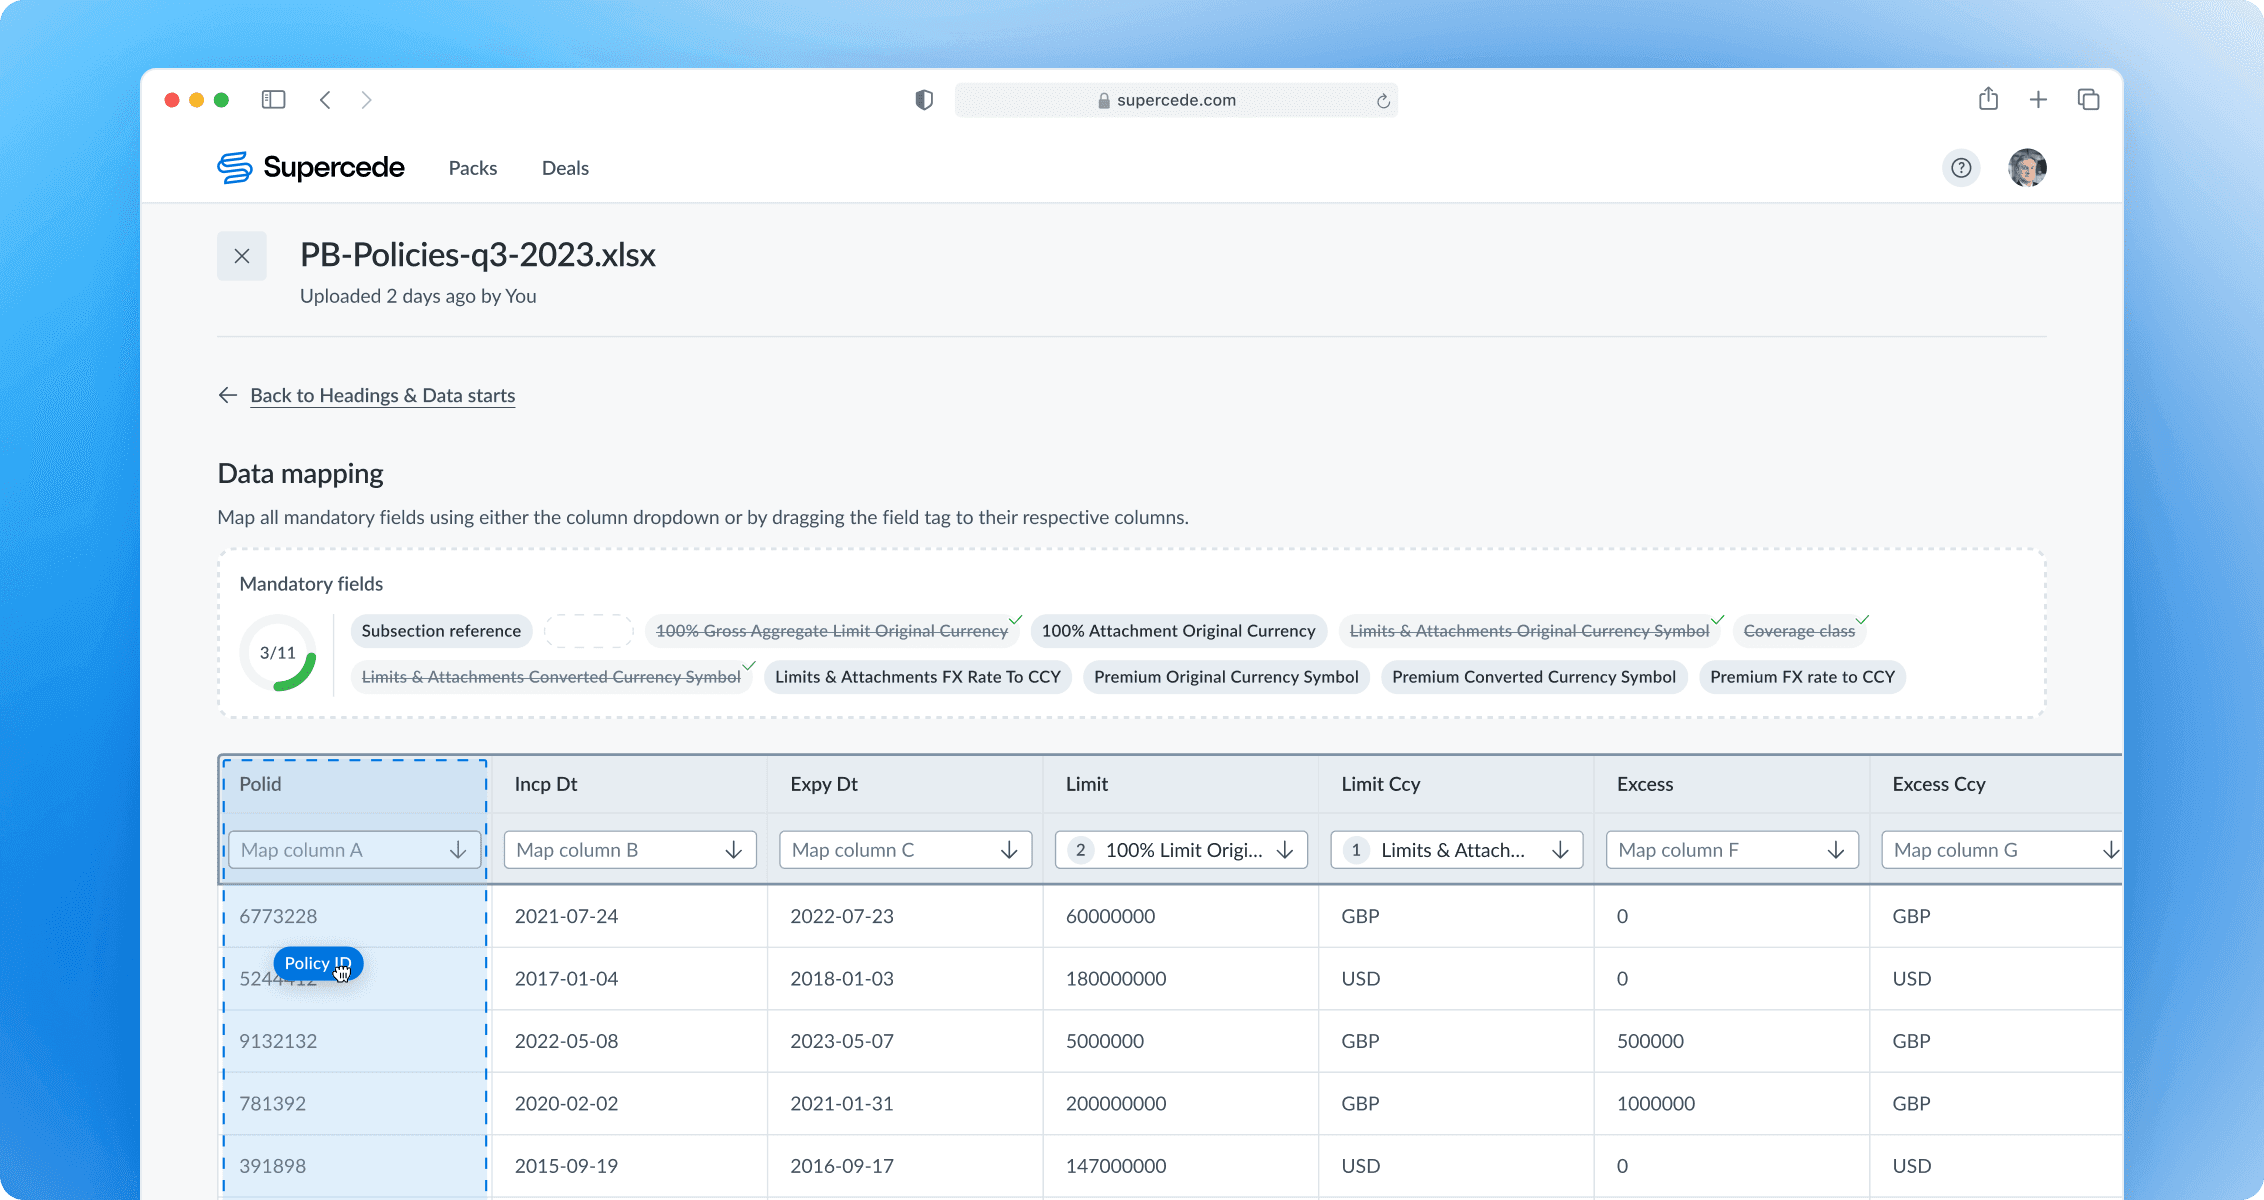
Users can map fields by attaching them to specific columns or using the derived fields feature for simple formulas or fixed values. A mandatory fields section displays a progress bar and a list of required fields to inform users of their progress and the work left. Users can apply fields using a dropdown in each column, allowing for 'one-to-many' mapping. The counter signals the number of fields attached to the column. The dropdown includes ‘Suggested’ fields to speed up user choice.
Specifying headings in a prior step allows adapting the table and placing headings at the top of the table, preventing the dropdown from obstructing their view.
Usability tests revealed that users often try to drag tags to the corresponding fields. Since this feature was relatively straightforward, it was decided to include it to enhance the mapping experience further.
Saving the mapping config for later
After successful mapping, users are redirected to the next screen, where they can name and save the mapping configuration for future use. If changes were made to a saved mapping, the form would ask if the user wants to update the existing configuration.
Design system
I created scalable components to work with various future designs. This includes but is not limited to a dragged state for a tag component, table enhancements like drag-and-drop for columns, embedded fields in table cells, and other updates and improvements.
Using components with Figma color variables applied, all designs are available in light and dark themes out of the box, improving flexibility and user experience.
Rollout and adoption
After a series of internal and alpha tests, we introduced the new data import feature as beta alongside template data import. All the training and support materials were created in advance and published in the company’s knowledge base.
Impact
The redesign significantly improved the data import experience, receiving positive feedback from users. An incremental increase in CSAT and CES supported this. The new importing experience is now widely used by Supercede clients and has become one of the key factors in the product's long-term growth.
Success metrics:
96%
Task Completion Rate
Reduced Time on Task
A trial contract won with a big-big industry player
A quarter after launch, non-template import continued to impact the data import experience positively. Non-template import (vs template) increased significantly to 28%.
For confidentiality reasons, I have omitted the actual values for the metrics.


